Temperature Sensors
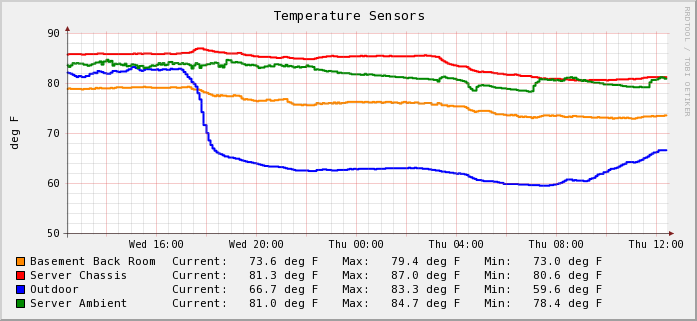
Temperature Records:
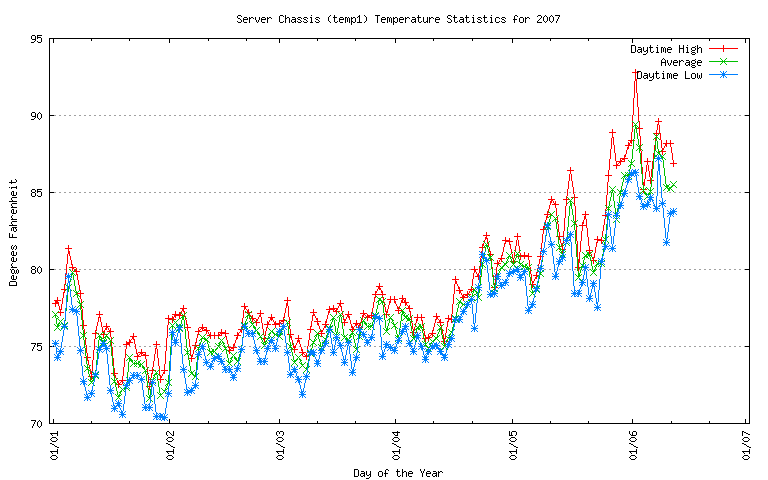
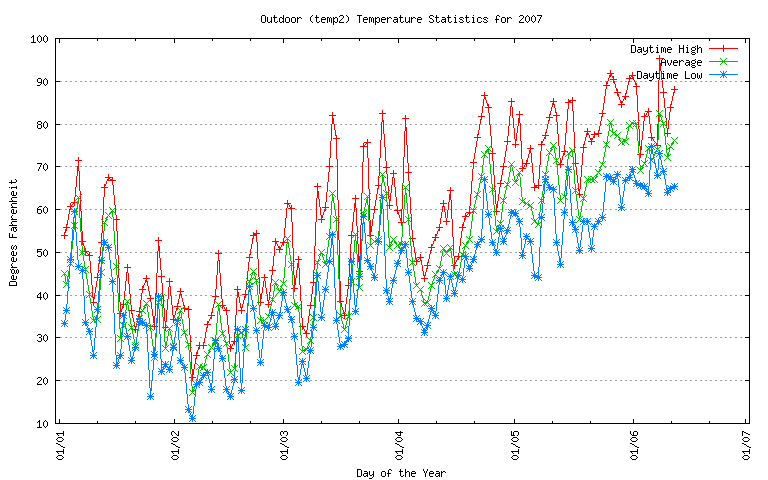
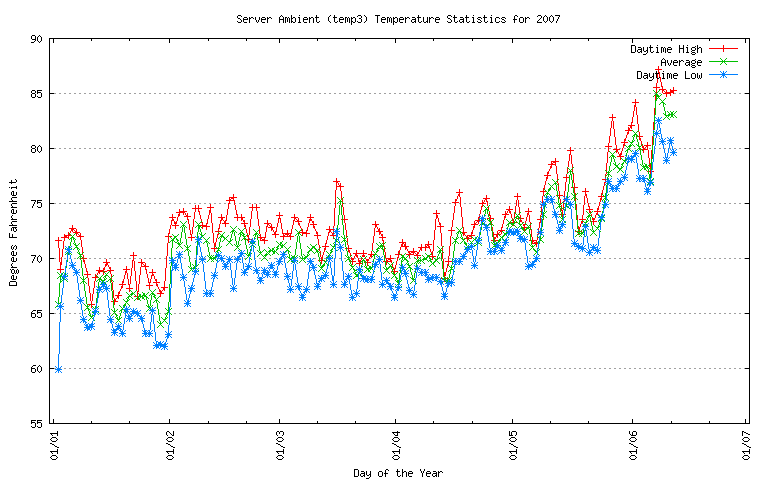
These are permanent records from a script which analyzes the temperatures after the daytime high and following overnight low are known. They are plotted with gnuplot.Temperature Records:
These are permanent records from a script which analyzes the temperatures after the daytime high and following overnight low are known. They are plotted with gnuplot.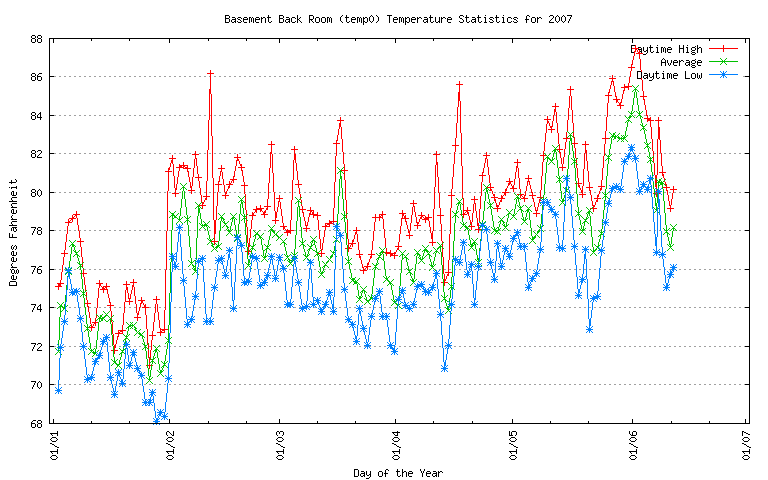